ECE 3310
Electrical Circuits: Laboratory
Signal Basics
©2008 by Professor Mohamad H. Hassoun
This
Unit is intended as a review of the mathematics of functions (signals) and
signal measurements.
Learning Objectives
By
the end of this Unit, the student should have an understanding of the basic
physical signals that are encountered in the study of electrical engineering.
The following are specific learning objective:
·
Identify a signal
as sinusoid, exponential, square, or triangular from a given plot or function.
· Define the following terms: amplitude, peak-to-peak,
period, frequency, average, RMS, duty cycle, rise time, fall time and decay
constant.
·
Define signal
time-shift and amplitude shift (dc
bias).
·
Compute a
signal’s amplitude, peak-to-peak, period, frequency, average, and RMS value,
given the a signal’s analytical expression
·
Measure a
signal’s amplitude, peak-to-peak, period, frequency, average, RMS value and dc
bias, given a plot of the signal (e.g., waveform displayed on an oscilloscope).
·
Determine,
experimentally and analytically, the duty cycle of a square wave.
·
Determine,
experimentally, the rise time and fall time of a pulse.
·
Determine,
analytically and experimentally, the phase shift between two sinusoidal signals.
·
Determine,
analytically and experimentally, the decay constant of an exponential signal.
Introduction
The
study of time varying signals is of fundamental importance in engineering.
Engineering students were introduced to signals (or functions) in high school
and freshman college math courses. A signal is described by a function of the
form y(x). For example, y(x) = x2
+ 1 represents a quadratic function (parabola). Here, x is referred to as the independent variable, and the value of y (the dependent variable) is determined
by the value of x.
In
engineering, functions where time is the independent variable are common. For
example, in electrical engineering, time-dependent voltage, v(t), or current, i(t), signals are encountered in circuit
analysis. Analog electronic circuits can be viewed as “signal processing”
systems that transform one analog signal into another. Circuits are used to output a (processed)
signal yout(t) in response to
an input signal yin(t).
The input signal could be a voltage signal generated by a function
generator. The output could be a current through or voltage across a particular
circuit component (say, a resistor, capacitor, or inductor).
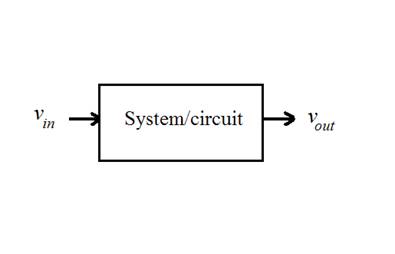
Figure
1 shows a circuit, and its corresponding block diagram. This circuit inputs the
sinusoidal voltage signal vin(t) and outputs the signal vout(t). Towards the end of the Linear
Circuits Analysis course, a student should be able to solve this circuit for
all voltages and currents.

(a) (b)
Figure 1. An electric circuit (a) can be viewed as a
system (b) that transforms one signal into another.

Figure 2. Input and response waveforms for the circuit
in Figure 1.
For
example, if the input signal is a cosine function with amplitude 12V and
frequency 2rad/sec [i.e., vin(t) = 12cos(2t)], the steady-state output signal (for the circuit in Figure 1)
is vout(t) = 8.37cos(2t - 0.95) Volts. The signals vin(t) and vout(t) are plotted in Figure 2. It is not
difficult to see how the system/circuit has attenuated the input signal
amplitude by about 30 percent [computed as 100*(8.37-12)/12)]; also, it has
shifted the input signal by an angle of 54o (computed as 0.95*180/p).
Basic Physical Signals
Physical
signals are those signals that can be generated in the laboratory,
experimentally, using physical devices. The basic physical signals encountered
in the analysis of linear circuits are: constant (dc), sinusoid (ac),
square, triangular and exponential (voltage and current) signal.
Constant Signal
A constant signal has the
form y(t) =
A, where A is a real-valued constant. As an example, Figure 3 shows a plot
of the two constant signals y(t) = 5 and g(t) =
-2.
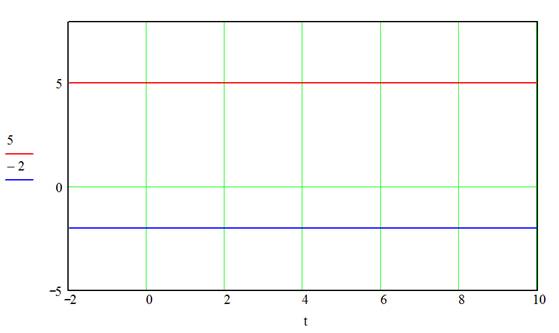
Figure 3. A plot of the signals y(t)
= 5 and g(t) = -2.
Sinusoidal Signal
Sinusoidal
signals are periodic signals of the form y(t) = Acos(wt + f), where the signal
parameters A (amplitude) and w (frequency in rad/s) are
positive real constants and f (phase or angle in rad) is a real constant. The sinusoidal signal may
also be defined in terms of the sine function; note that Acos(wt)
= Asin(wt + p/2). Figure 4 shows a plot of
the signals y(t) = 3cos(2t + 1) and g(t) = 2sin(3t).

Figure 4. A plot of the signals y(t) = 3cos(2t + 1) and g(t) = 2sin(3t).
Periodic Square Signal
A periodic
square signal consists of a train of pulses. The signal is defined in terms of
an analytical expression, specified over one complete period. The following is
an example of a repeating square signal whose plot is shown in Figure 5:
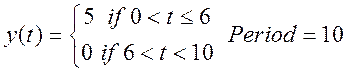

Figure 5. A plot of a square signal that repeats every
10 seconds.
Periodic Triangular Signal
Periodic
triangular signals are repeating, piece-wise linear signals. They are defined
in terms of an analytical expression, specified over one complete period. The
following is an example of a repeating triangular signal whose plot is shown in
Figure 6.


Figure 6. A plot of a triangular signal that repeats
every 8 seconds.
Exponential Signal
An
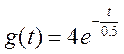
exponential signal has the functional form: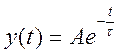 , where A is
a real-valued constant, and t is a positive-real constant (called the time constant). The time constant, t, determines the decay rate of y(t). Figure 7 compares the plots of
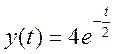 and
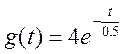 .
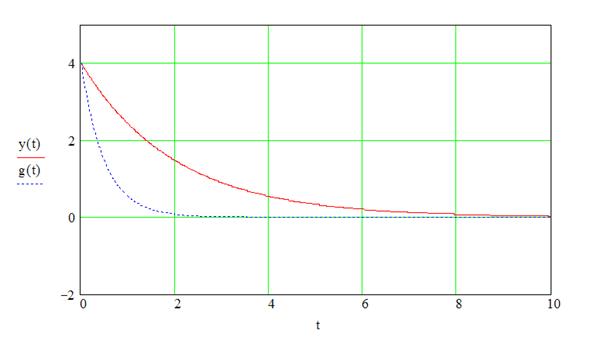
Figure 7. A plot of the signals 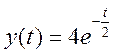 and
 .
Signals with dc Bias
dc bias is achieved by adding a constant B to a signal y(t). This results in
shifting all the values of y(t) by B, for all t. The plots of y(t) = 3cos(2t)
and g(t) = 1 + 3cos(2t) are shown in Figure 8.

Figure 8. A plot of the signals y(t) = 3cos(2t) and g(t) = 1 + 3cos(2t ).
Time Shifted Signals
A signal
may also be shifted in time by adding a constant a to the time variable t; i.e., y(t) is transformed into y(t
+ a). When a is negative (positive), the
signal y(t + a) is shifted to the right (left). For example,
consider the signal y(t) = 3cos(2t). Shifting t by -1 leads to y(t - 1) = 3cos[2(t - 1)] = 3cos(2t - 2). Note how the angle of a sinusoid
is related to time-shift. Figure 9 compares y(t - 1) = 3cos(2t - 2) to y(t) = 3cos(2t).

Figure 9. A plot of the signals y(t) = 3cos(2t), and y(t - 1) = 3cos(2t - 2).
Signal Measurement Definitions
Important
measurements of periodic signals are defined in this section. They include: amplitude, peak-to-peak, period, frequency, average, and RMS values.
For square signals, the following measures are defined: duty cycle, rise time and
fall time. The decay constant, a useful measure for exponential signals, is
defined. Also, this section presents two methods for experimentally measuring
the phase difference between two
sinusoidal signals.
Amplitude
The
amplitude of a pure sinusoidal signal (refer to Figure 10) is equal to its
maximum value. Therefore, the amplitude of v(t) = Asin(wt) is A Volts.

Figure 10. Sine signal: y(t) = Asin(wt).
Peak-to-Peak
Value
The
peak-to-peak voltage, VPP,
is defined as the difference between the maximum and the minimum values of the
signal. For example, VPP =
2A for the signal y(t) = Asin(wt).
Period
and Frequency
The
period, T, of a repetitive signal is
defined as the time it takes for the signal to undergo one complete cycle
(refer to Figure 10). The frequency, f,
of a signal is the number of cycles per second. In other words, f = 1/T cycles/sec, or Hz. f is
referred to as the Hz-frequency. The radian frequency of a signal is defined as
w = 2pf rad/sec.
As an example, the signal y(t) = 3cos(2t) has w = 2 rad/sec, f = w/2p = 2/2p = 0.3183
Hz and a period T = 1/f = 3.1415 sec.
Average
Value
The
average of a periodic signal y(t) is defined as
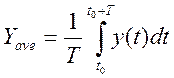 (1)
where t0 is any constant (including
0) and T is the period. Equation (1)
suggests that the average value can be determined (by inspection, if possible)
as the “area under the curve” of one signal period divided by T. For example, the average of the signal
y(t) = Asin(wt) is zero since the area under the curve is zero.
RMS
Value
RMS
value (also known as the effective or
dc value) is the root-mean-square
value of the signal. For a periodic signal y(t), the RMS value, Yrms,
is defined as
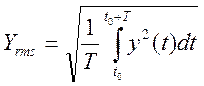 (2)
A
voltage signal v(t) placed across a resistor R, delivers an average power equal to  ; this is the same power that a constant voltage signal (dc voltage)
 would have delivered
to the resistor. Therefore, the RMS value is also called the effective or dc value of the signal. Note that the RMS value for a constant signal, y(t) = B, is B.
For
pure sinusoidal signals of the form v(t) = Acos(wt + f), the RMS value is equal to
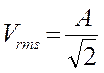 . Note that the RMS value is not affected by the frequency or
phase (time-shift) of the signal. The sinusoidal voltage signal delivered by a
house’s electric outlet is rated at 120Volts. This is the RMS value of the
voltage signal. Since the frequency is 60 Hz, one can write the expression for
the voltage signal as
 Volts. This can be
verified by plugging v(t) in Equation (2), to obtain (employing
Mathcad software):
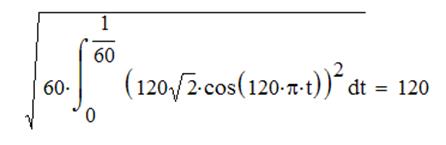
The
signal v(t) and its RMS value are shown in Figure
11.

Figure 11. Voltage signal from a house’s electric
outlet and its RMS value.
Bias Effects on Average and
RMS Values
Given
the signal y(t) and its average value, Yave,
and RMS value, Yrms.
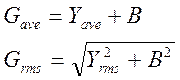
How does adding a constant B to y(t) affects the
average and RMS values of the biased signal? Let the biased signal be g(t) = y(t) + B.
It can be shown that the biased signal average and RMS values are given by
Duty
Cycle
Consider
a pulse train (square) signal with period T.
The duty cycle is the ratio of the
pulse width (Width, refer to Figure
12) to the period, expressed as a percentage:
Duty cycle = 100*(Width)/T

Figure 12. Pulse width of a triangular signal
Rise
Time and Fall Time
The
rise time and fall time of a pulse are depicted in Figure 13. The dashed
horizontal lines represent the 10% and 90% of the signal’s peak-to-peak value.
The rise time is the time it takes the rising edge of the pulse to go from the
10% threshold to the 90% threshold. Similarly, the fall time is the time it
takes the falling edge of the pulse to go from 90% to 10% threshold. Generally
speaking, the rise time is not equal to the fall time.

Figure 13. Rise time and fall time of a signal
Time Constant
The
exponentially decaying signal of the form appears in the natural
response of all RC and RL circuits. For example, in a parallel
RC circuit where the capacitor has an initial voltage V0, the resistor (and capacitor) voltage decays as 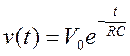 , for t > 0. The
product of RC has the unit seconds,
and it controls the rate at which the voltage decays. In circuit textbooks, the
constant RC is renamed as t (the circuit time constant).
Figure
7 (see above) show plots of for A = 4 and t = 0.5 and 4. The larger
the time constant is, the slower the
rate of decay. When t = 0, the signal
value is A. When t = t, the signal value drops to A/e = 0.368A, or about 63.2 percent of the value of the signal at t = 0. Therefore, the time constant (of
an exponentially decaying signal) is defined as the time it takes the signal to
drop by 63.2 percent of its initial value, at t = 0. Given a graph of , one can employ this definition to approximate the time
constant (Problem 5). See Problem 6 for an alternative graphical method for
estimating t.
It
should be noted that the signal drops by over 99 percent after 5 time
constants; 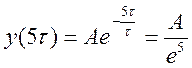 = 0.0067A, which corresponds to 99.33% of A.
Phase
Difference
In
practice, one could use an oscilloscope to display and compare two voltage
signals. When dealing with steady-state RLC circuits under sinusoidal input,
say vin(t) = Vcos(wt), all voltages and currents in the circuit have the
functional form y(t) = Acos(wt - f). The angle constant f (measured in radians) is the phase shift between the
response signal and the input signal.
The
angle f can be
transformed to reflect the amount of time shift between the signals y(t) and vin(t). The
signal y(t) = cos(wt - f) can be rewritten as y(t) = cos[w(t - f /w)]. If we define the signal g(t)
= cos(wt) as a
reference signal, then y(t) = g(t - f /w). In other words, y(t) is obtained by time shifting the
reference signal g(t) by f /w seconds. When f is positive, the waveform
of y(t) is (delayed) shifted to the right of g(t).
The
above analysis suggests a method for measuring the phase difference between two
sinusoids (of equal frequency) acquired by a two channel oscilloscope. First,
one of the signals is used to measure the period T. Next, the scope’s X-cursor is used to find the time difference
between the t-intercept of one signal
and the closest t-intercept of the
second signal. Let the difference be Dt. Finally,
the phase difference is computed as f =w Dt = 2pDt/T radians,
or f = 360Dt/T degrees. For example, the phase
difference between the two signals in Figure 14 is f = 2pDt/T = (2p)(0.5- 0.25)/(0.24 - (- 0.76)) = 1.57
rad (or about 90 degrees). We measured the
phase of the “dotted-line” signal with respect to the “solid-line” signal. In
other words, the solid-line signal is our reference signal. The solid-line
signal is g(t) = cos(2pt), and the dotted-line signal is y(t) = cos(2pt – 1.57).
We say that y(t) is delayed by 0.25 sec relative to g(t).
We may also say that y(t) lags g(t) by about 90 degrees.
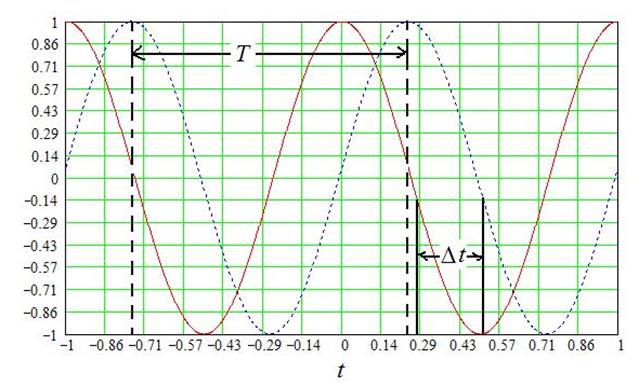
Figure 14. Approximating the phase difference between
two sinusoids.
The
Lissajous method may also be
used to measure the phase difference between two sinusoidal signals of the same
frequency and amplitude. This method assumes that an oscilloscope, operating in
the XY mode, is used to acquire the signals. Here, one signal is connected to
Channel 1 of the scope, and the second signal is connected to Channel 2. The
displayed waveform (an ellipse, see Figure 15) should be centered (using the
vertical position knobs) at the display’s center point. The phase difference
can now be computed as (in reference to the labeled distances in Figure 15): f = sin-1(C/D).
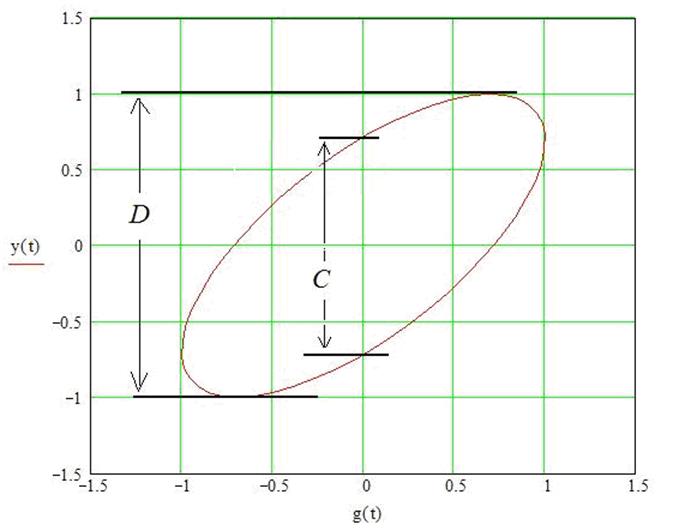
Figure 15. Measuring phase difference using the
Lissajous method.
Pre-Lab Activity (Experiment 2)
1. Determine the average, RMS, and duty-cycle values for
the signal in Figure 5.
2. Determine the peak-to-peak, average and RMS values for
the signal in Figure 6.
3.
Show that the RMS
value for the signal y(t) = Asin(wt) + B is
given by
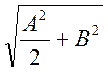
Now, find the RMS value for the signal y(t) = 5sin(wt) + 2 and compare it to the sum of the individual RMS
values of the signals g(t) = 5sin(wt) and h(t) = +2.
4. The rising edge of a pulse signal is shown below.
Determine the rise time.

5. Employ the following plot of an exponential signal to
approximate the signal’s time-constant.

6. Show that 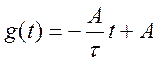 is the equation of the
line tangent to the function
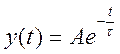 at t = 0. Show
that the line intersects the t-axis
at t = t. This suggests a two-step graphical method for
determining the time constant t: (1) Draw a line tangent to y(t) at the point (0, A), then (2) t is the point at which this line intersects the time axis. Employ the tangent line method to estimate t for the function y(t) in Problem 5.
7. Employ the following plot of two sinusoidal signals to
approximate the difference in phase (angle) between g(t) and y(t). Give your answer in degrees.

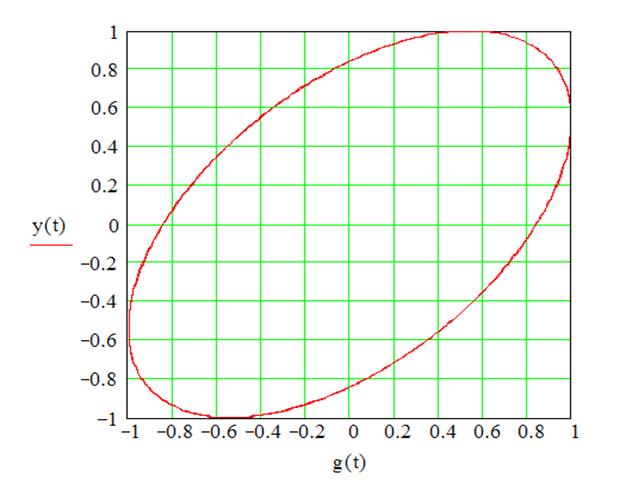
8. Employ the
following plot of two sinusoidal signals [plotted as y(t) vs. g(t)] to approximate the difference in
phase between the signals. Give your answer in degrees.
9. It can be shown that the sum of two sinusoids, Acos(wt) + Bsin(wt),
is equal to Ccos(wt + f) where,

Express the signal cos(2t)
+ 2sin(2t) as Ccos(wt + f). Check your answer by comparing the plots of the two signals: cos(2t)
+ 2sin(2t) and Ccos(wt + f). Verify that both signals
have the same RMS value.